The Distribution of Lay Wealth in Kent, Surrey, and Sussex, in the Early Fourteenth Century
Contributions to the next volume are welcome. See the guidance for contributors and contact Editor Jason Mazzocchi. Also see the guidance for peer review.
Search page
Search within this page here, search the collection page or search the website.
An Acheulian Site at Cuxton
Eccles Frontispiece
The Distribution of Lay Wealth in Kent, Surrey, and Sussex, in the Early Fourteenth Century
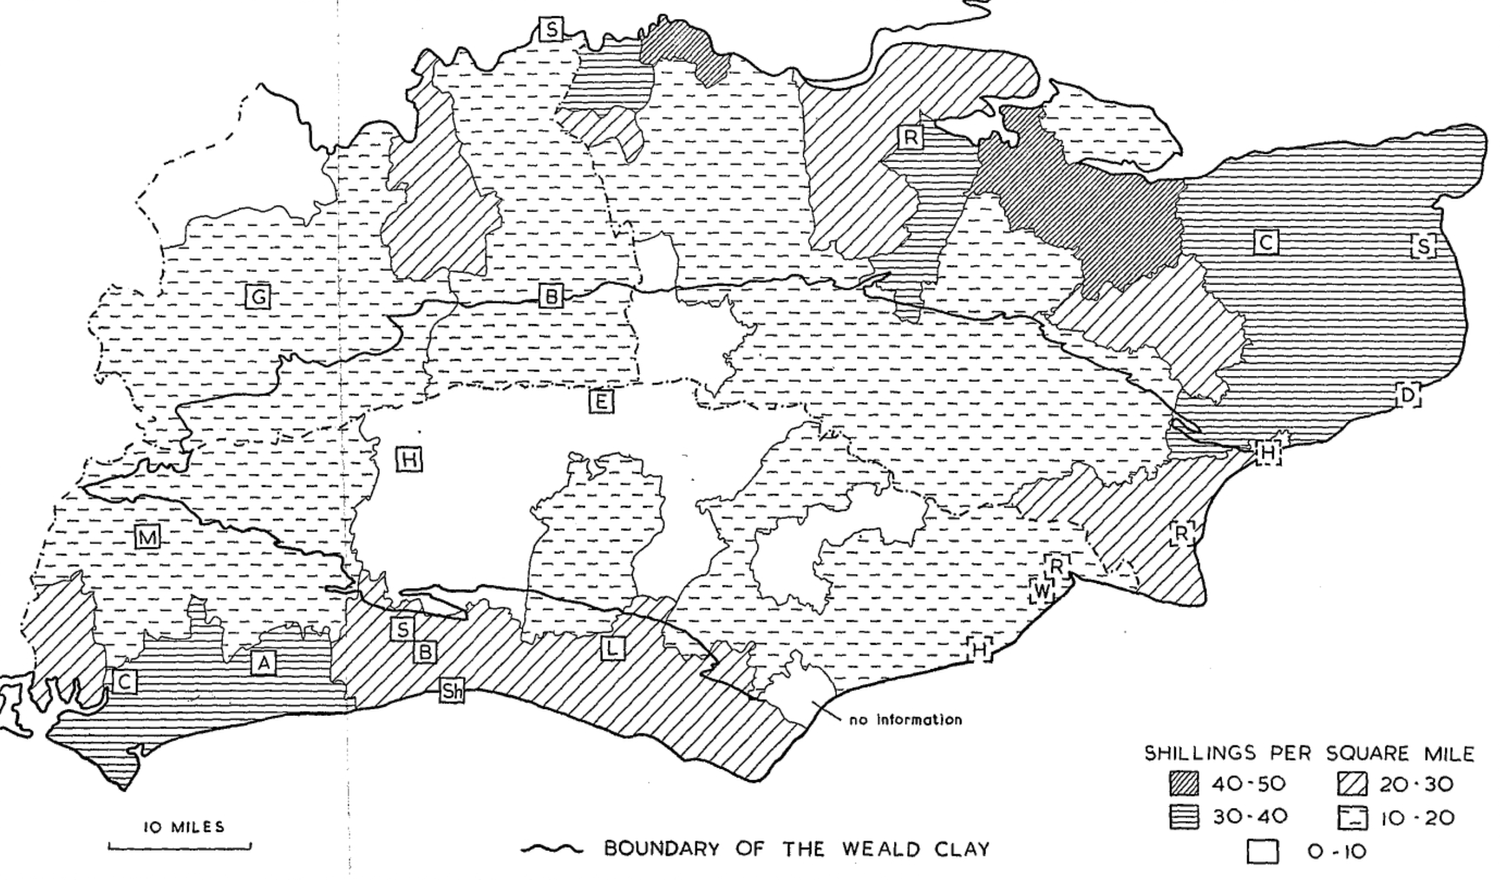
THE DISTRIBUTION OF LAY WEALTH IN KENT, SURREY, AND SUSSEX, IN THE EARLY FOURTEENTH CENTURY By R. E. GLASSCOCK IN his part of the valuable introduction to the recent pubhcation of the 1334 Lay Subsidy for Kent, C. W. Chalklin uses the subsidy as an indicator of the distribution of wealth within the county and discusses the average tax payments by individuals in different areas.1 This short paper aims to take this line of study a stage further by producing a map of the 1334 assessment for Kent, commenting on the regional variations, and comparing the lay wealth of Kent with that of its neighbours Surrey and Sussex. 1334 is a particularly valuable date at which to survey the distribution of wealth within the county for it enables us to see the situation as it was just before the Black Death and before the great social and economic changes of the years after 1350. Moreover 1334 is the only year when the situation in Kent may be compared with that in the rest of England as the 1334 Lay Subsidy is the only one of the early fourteenth century taxes upon movables whose coverage enables us to reconstruct a picture of the country as a whole.2 This is possible because the quotas of taxation agreed upon in 1334 were standardized in 1336 and did not finally disappear until 1623. This means that for almost every county in England where the 1334 rolls do not survive, the information may be obtained from later tax rolls. Kent is the one county where this might be impossible as the system of individual taxation continued in the county and instead of the 'freezing' of the 1334 tax quotas, the assessments changed at subsequent grants. Luckily the problem is averted as the detailed 1334 roll for Kent survives in the Pubhc Record Office, London.3 A number of maps and commentaries have already appeared dealing with regional prosperity and the distribution of wealth for 1 C. W. Chalklin, in H. A. Hanley and C. W. Chalklin eds., 'The Kent Lay Subsidy of 1334/5,' Kent Records, 18 (1964), 58-172. 2 The standard work on the early fourteenth century lay subsidies is J. F. Willard, Parliamentary Taxes on Personal Property, 1290-1334, Cambridge, Mass., (1934). 3 E 179/123/12. 61 DISTRIBUTION OF LAY WEALTH IN KENT, SURREY AND SUSSEX various counties in 1334.4 The map for Kent, Surrey and Sussex included here adds a further piece to the jigsaw.5 The ever-widening picture must, however, be treated with caution. We must be under no illusions about the two great drawbacks in the source material. Firstly, the 1334 assessments were not on total wealth. Many people were exempt below the taxable minimum and no doubt there was widespread evasion and under valuation.6 Secondly, as Willard has shown, most of the movable wealth of the Church was excluded from the lay subsidies.7 Ideally therefore we want a map of the clerical wealth in Kent in the early fourteenth century to complement that for lay wealth before we can be sure of the real distribution of wealth within the county. Until this is done a picture of total wealth is impossible: the best that we can hope for is that the 1334 assessments are a useful guide to relative wealth from place to place. Apart from these exemptions there are in Kent the special exemptions of the moneyers of Canterbury and the men of the Cinque Ports, and in addition, the nature of the Kent returns prevents any comparison of either the size or prosperity of the urban centres.8 With these limitations in mind there follows some general remarks on the distribution of lay wealth in rural Kent in 1334. THE DISTRIBUTION OF LAY WEALTH IN KENT Kent is considered in terms of the county as it was in the mid nineteenth century before certain parishes were detached to form part of the administrative county of London. Unfortunately, as the Kent roll is unique among 1334 rolls in not giving place-names we can get no *• E. J. Buckatzsch, 'The geographical distribution of wealth in England 1086-1843,' Economic History Review, 2nd series, 3 (1950), 180-202; F. W. Morgan, 'The Domesday geography of Devon,' Transactions of the Devonshire Association, 72 (1940), 321; B. Reynolds, 'Late medieval Dorset: three essays in historical geography' (unpublished M.A. thesis, University of London, 1958); C. T. Smith, in Victoria County History, Leicestershire, 3 (1955), 134; H. C. Darby, The Medieval Fenland (1940), 134-5; W. G. Hoskins and E. M. Jope, in A. F. Martin and R. W. Steel, eds., The Oxford Region (1954), 109; R. E. Glasscock, 'The distribution of lay •wealth in south-east England in the early fourteenth century (unpublished Ph.D. thesis, University of London, 1963); R. E. Glasscock, 'The distribution of-wealth in East Anglia in the early fourteenth century,' Institute of British Geographers, Transactions and Papers, 32 (1963), 113-123; R. E. Glasscock, 'The Lay Subsidy of 1334 for Lincolnshire,' The Lincolnshire Architectural and Archaeological Society, Reports and Papers, 10, part 2 (1964), 115-133. 6 The author has prepared a map for the whole of England. This is expected to appear in H. C. Darby, ed., An Historical Geography of England before 1900 (forthcoming). 6 See Willard, op. cit., 139-41, and Chalklin, op. cit., 63-4. For an interesting local example of the sort of bribery that took place when goods were assessed, see P. D. A. Harvey, A medieval Oxfordshire village: Cuxham, 1240 to 1400, (1965), 105-7. . 7 Willard, op. cit., 102-9. 8 Chalklin, op. cit., 67. 62 DISTRIBUTION OF LAY WEALTH IN KENT, SURREY AND SUSSEX idea of the relative prosperity of towns and villages, and it is only possible to map the assessments as they appear on the roll, by hundreds. Yet while we know the position of the hundreds in the early fourteenth century9 their exact outlines and areas are not known. In calculating average assessments per square mile I have used the late nineteenth century acreages of the parishes in each hundred, as listed by Wallenberg. 10 The slight inaccuracies of such an approach are obvious but unavoidable, and they certainly do not alter the general picture. The quotas of Canterbury and Rochester are excluded from the calculations. From his study of local rolls before 1334 Willard has suggested that the goods taxed as movables represent the surplus over and .above the basic essentials that a family needed to live and work.11 This idea is supported by the detailed work of Gaydon for Bedfordshire,12 and Salzman for Sussex.13 Certainly it would help to explain, in addition to the non-assessment of poorer people, why so few people are listed on the tax rolls, as few people in any village would have produced a surplus. In the Weald for example, where farms were small and scattered, agriculture was not geared to the production of surplus by contrast to north-east Kent where it was. Accepting Willard's thesis a map showing the average 1334 assessments from place to place (Fig. 1) in fact shows the distribution of surplus or saleable produce from which income could be gained. On the assumption that the tax assessment reflects the ability of an area to pay we can get an approximate idea of the distribution of lay wealth in the county. The most striking feature of the map is the comparative poverty of the Weald and Romney Marsh relative to the north-east. The map supports Chalklin's view that 'the wealth of the inhabitants depended fairly closely on the fertility of the soil.'14 As the main geographical regions of Kent emerge fairly clearly from the map it will be convenient to discuss the map under the headings of the two principal divisions, the Weald and Romney Marsh, and North Kent. THE WEALD AND ROMNEY MARSH Whereas the Weald Clay and the High Weald were areas of low assessments, for the most part under 15s. per square mile, by comparison 9 Ibid., map following page 172. 10 J. K. Wallenberg, The Place-names of Kent, Uppsala (1934). 11 Willard, op. cit., 84-5. 12 A. T. Gaydon, 'The Taxation of 1297,' Bedfordshire Historical Record Society, 39 (1959). 13 L. F. Salzman, 'Early Taxation in Sussex,' Sussex Archazological Collections, 98 (I960), 29-43, and 99 (1961), 1-19. 14 Chalklin, op. cit., 68. 63 DISTRIBUTION OF LAY WEALTH IN KENT, SURREY AND SUSSEX i 35 25 22 14 5 17 32 f 38 25 8 v 33 <~8 2 32 /.2 3 'J I a 35 h-1 2 19 H 22 KENT R ASSESSMENT IN I334 SHILLINGS PER SQUARE MILE 40-SO [ZJ20-30 30-40 Q I O - 20 M O -IP Fio. 1. Canterbury and Roohester, and the Cinque Ports of Dover, Hythe, New Romney and Sandwich are denoted by initials. The northern boundary of the Weald Clay is shown. with north-east Kent, the Weald was by no means poverty stricken. The traditional view of the Weald as an unsettled area, hostile to settlement and agriculture, and used only for swine pannage was a thing of the past by 1300. J. L. M. Gulley, in his account of the geography of the Weald in the early fourteenth century,15 has shown that while much woodland remained, the Weald was an area of mixed farming with an emphasis on animal husbandry. Cattle and swine were reared and grazed on both enclosed and common pastures. While oats was the commonest grain crop wheat was grown on the heavier soils, especially on the Weald Clay. By 1334 the landscape had already begun to assume many of the characteristics known today, with woodland, hamlets and farms in small clearings, agriculture on the more favourable 16 J. L. M. Gulley, 'The Wealden landscape in the early seventeenth century and its antecedents' (unpublished Ph.D. thesis, University of London, I960), 294-387. 64 DISTRIBUTION OF LAY WEALTH IN KENT, SURREY AND SUSSEX soils, orchards and even parkland. Much heathland must have remained in the western Wealden districts of Kent. Clearly the Weald was an area of subsistence rather than commercial agriculture and as such we are unlikely to find many people producing much surplus to be taxed as movable wealth. Nevertheless for what the Weald lacked in movables it was amply compensated in its timber resources which by 1334 were already becoming the basis for the iron and glass industries of the later middle ages. Also, just at this time, the cloth industry was beginning to grow in and around Cranbrook in the central Weald.16 As an area of intense agricultural activity it is no surprise that the assessments of around 20s. per square mile of Romney Marsh and its surrounding area were higher than those in the Weald proper and in much of north-west Kent. The lists of personal names in the subsidy suggest that the population density of Romney Marsh and its surrounds was comparable to that of north-west Kent and very much higher than that of the Weald.17 We know from the work of R. A. L. Smith,18 and Miss Ann Smith,19 on the Canterbury Cathedral Priory estates that while Romney Marsh was a great centre of pasture farming and especially of cheese-making, it was also important for crops, as oats were particularly suited to the heavy lands, as were beans. The enormous efforts of the monastic houses to reclaim, drain and work the marshland in the late thirteenth and early fourteenth centuries testify to the value of the land and to the wealth which it must have carried.20 NORTH KENT Apart from the great difference between the movable wealth on the chalk downs and that on the rich loams of the north-east lowlands the assessments in the north do not reflect the various east-west regions of this part of the county. The highest assessments, between 32 and 40 s. per square mile, were in the north-east lowland, Thanet, and along the northern edge of the Downs. The figures are shghtly higher than those around Rochester and the Medway. Generally speaking the western part of north Kent carried only about half the movable wealth of the north-east, although it seems to have been an area of extremes. For example, whereas the Thames-side hundreds of Blackheath and 16 Gulley, op. cit., 377. 17 Chalklin, op. cit., 65. 18 R. A. L. Smith, Canterbury Cathedral Priory (1943). 19 Ann Smith, 'A geographical study of agriculture on the Kentish manors of Canterbury Cathedral Priory, 1272-1379' (unpublished M.A. thesis, University of Liverpool), undated. 20 R. A. L. Smith, op. cit,, 146-189, and also N. Neilson, The Cartulary and Terrier of the Priory of Bilsington, Kent (1928). 65 5 DISTRIBUTION OF LAY WEALTH IN KENT, SURREY AND SUSSEX Little were surprisingly rich, the inland hundreds of Ruxley, Axton, Codsheath and Wrotham, which must have contained much heathland and scrub, were rather poor, with average assessments only slightly higher than those of the Weald. The lay wealth of north-east Kent was the highest in England south-east of a line Great Yarmouth to Southampton. Only parts of the Sussex coastal plain and the Thames valley carried comparable wealth. As Chalklin has shown, the 1334 subsidy suggests that northcentral and north-east Kent were the most populous parts of the county. Pelham has shown that in 1297 north-east Kent was barley and wheat country,21 the more valuable commercial grains by comparison with oats, the chief crop of the Weald and Romney Marsh. Miss Smith has shown that wheat was the most important crop overall on the manors of Canterbury Cathedral Priory in the north-east, on account of its adaptability to a wide variety of soils and its high market value. Barley was the most important crop of the light soils, for example on the easily worked Brickearths of Thanet.22 While the prosperity of north-east Kent may be partly explained by soil fertility part of the answer must also lie in agricultural practice and organization. It was in north-east Kent that some of the most highly specialized and efficient grain farming of medieval England had been developed in the late thirteenth and early fourteenth centuries. On their large estates midway between the markets of London and the continent the Benedictines of Canterbury improved the yields of both seed and land in their drive to take advantage of rising grain prices in the years after 1300.23 The extent of their achievement may be seen in Prior Eastry's remarkable survey of 1322 which shows the great area under wheat in east Kent, under oats on the marshland manors, and the importance of peas and beans in the various rotations.24 While the efficiency of the Benedictines alone cannot account for the great prosperity of this corner of the county their example in the half century before 1334 must have rubbed off on other lay and ecclesiastical landlords. Indeed, if we had a complementary map of clerical wealth north-east Kent might appear even richer by comparison with the rest of the county. More than anywhere else in Kent this area was concerned with producing food for markets, and if as Willard suggests the movable goods taxed represented saleable surplus it is not surprising to find such high assessments in this part of the county. » R. A. Pelham, 'Fourteenth-century England,' being Chapter VI of H. C. Darby, ed. An Historical Geography of England before 1800 (1936) (Fig. 33). 22 Ann Smith, op. cit., 40. 28 R. A. L. Smith, op. cit., 128-145, and R. A. L. Smith, 'The Benedictine contribution to medieval agriculture,' in Collected Papers (1947), 103-16. 24 R. A. L. Smith, op. cit. (1943), I40-I. y. R L A V f 3- 41- B ( ~\ / HI i » i H 0H T M- rSI ^StfW) ^ H m, B 2 Sh no Intormat on SHILLINGS PER SQUARE MILE 4 0 - 5 0 [Z3 20 • 30 30-40 ra IO -20 10 MILES BOUNDARY OF THE WEALD CLAY • O - IO Fi». 2. The 1334 assessment in Kent, Surrey and Sussex. The quotas of all cities and boroughs denoted by initial letters are excluded from the calculations. Kent Canterbury and Rochester. Surrey Bletchingley, Guildford and Southwark. Sussex Chichester, Arundel, Bramber, Bast Grinstead, Horsham, Lewes, Midhurst, Shoreham and Steyning. The Cinque Ports, for which there is no 1334 data, are also marked by initial letters, from north to south, Sandwich, Dover, Hythe, New Romney, Rye, Winchelsea and Hastings. There is no information for the Lowey of Pevensey. DISTRIBUTION OF LAY WEALTH IN KENT, SURREY AND SUSSEX THE WEALTH OE KENT BY COMPARISON WITH ELSEWHERE AND PARTICULARLY WITH SURREY AND SUSSEX By multiplying the assessments at a Tenth and Fifteenth, the total taxable wealth of Kent in 1334 was £27,803 14s. 0|d. This was the fourth highest county total in England, ranking behind Norfolk (£50,827 7s. 6d.), Lincolnshire (£46,062 15s. 8jd.), and Yorkshire (£34,709 7s. 0|d.).25 Kent's impressive total was largely due to its size, for in terms of taxable wealth per square mile Kent's figure of £17 I7s. Od. ranks only eighth behind Oxfordshire (£26 12s. Od.), Norfolk (£24 17s. Od.), Rutland (£23 8s. Od.), Bedfordshire (£21 8s. Od.), Berkshire (£20 7s. 0d.), Middlesex (£18 lis. 0d.), and Gloucestershire (£18 4s. 0d.). Kent's figure was lowered by the comparatively low assessments in the Weald and along the ridge of the Downs. By contrast, north-east Kent on account of its position, fertility, and agricultural organization, was the largest continuous area assessed at over 20s per square mile in south-east England. Only the Thames valley and the Sussex coastal plain were in any way comparable. The assessment of north-east Kent was one of the highest figures in the country in 1334 and comparable to that of much of Oxfordshire, Norfolk, and central Cambridgeshire, all very rich agricultural areas. By contrast to its immediate neighbours, Surrey and Sussex, Kent was a rich county. Compared with Kent's taxable wealth per square mile of £17 17s. Od. Sussex averaged only £11 2s. 0d., and Surrey £11 Is. Od.26 The assessment for the three counties is shown in Pig. 2. Almost all of Surrey was assessed at between 10 and 20s. per square mile. Only along the Thames valley near Kingston and Richmond was the assessment above 20s., the same sort of figure as in Kent west of Rochester. At the other end of the scale the Bagshot region was very poor and the only comparable figure in Kent was that for the Wealden hundred of Somerden in the south-west of the county, where the subsidy suggests that the population was very low. Sussex, like Kent, had a considerable variety of movable wealth ranging from 4s. per square mile in the central Weald to over 30s. on the west Sussex coastal plain. As in Kent the pattern of wealth shows a very clear relationship to topography and soils. In the Weald 26 Chalklin's statement (op. cit., 67) that the total wealth of Kent was second only to that of Norfolk is not correct, as in the list by W. G. Hoskins to which he refers the historic divisions of Lincolnshire and the Ridings of Yorkshire are listed separately. When added together they show that both Lincolnshire and Yorkshire had far greater total assessments than Kent. 28 The 1334 assessments for Surrey and Sussex are already published, viz. W. Hudson, 'The assessments of the hundreds of Sussex to the King's tax in 1334,' Sussex Archceological Collections, 60 (1907); Surrey Taxation Returns, Part B (1932) for transcription of 1336 roll. The 1334 quotas for Surrey are also listed by H. E! Maiden in Victoria County History, Surrey, 1 (1902), 441-4. 67 DISTRIBUTION OF LAY WEALTH IN KENT, SURREY AND SUSSEX assessments were low, generally between 4 and 15s. per square mile, with the lowest values on the Weald Clay and the sands east of Horsham. The assessments were shghtly higher along the coastal fringe of the Weald between Pevensey and Rye, but in common with the chalk and Lower Greensand around Midhurst in the west, the value of movable property was only moderate. On the other hand, the chalk east of Worthing carried greater wealth probably due to the good agricultural land on the Clay-with-flints and also to the proximity of the coastal settlements. The greatest wealth, comparable to Thanet, was on the fertile and densely settled coastal plain south of Chichester where the assessments averaged between 30 and 33s. per square mile. The map of the 1334 assessment in Sussex substantiates Hudson's view that 'the wealth of the county was derived from its maritime agricultural districts.' 27 The 1334 pattern has also been verified by Pelham in his detailed studies of the 1327 subsidy and the Nonae Rolls of 1341 for the county.28 Not only has he shown that the wealth per capita was greatest on the chalk and along the coast, but from the Nonae he has shown that this was due to the overwhelming importance of corn growing in Sussex, especially wheat. In conclusion much the same could be said of Kent. The prosperity of the coastal fringe of south-east England, outside the Weald, was due not only to its fertility, but also to its nearness to markets at home and on the continent, and the sea transport whereby to carry produce. In terms of movable wealth in 1334 these advantages seem to have been enjoyed over a greater area of Kent than of Sussex and Hampshire, and together they made north-east Kent one of the richest parts of fourteenth century England. 27 Hudson, op. cit., 163. 28 R. A. Pelham, 'Studies in the historical geography of medieval Sussex,' Sussex Archceological Collections, 72 (1931), 157-84, and 'Some Medieval sources for the study of historical geography,' Geography, 17 (1932), 32-8. 68